USA, Cement Industry
The US economy is the largest in the world with GDP of over US$ 15 tn in 2011, although the country ranks behind a small number of developed nations in terms of GDP/capita.
The US has a service-based economy (77% in 2011) with an historical emphasis on production and manufacturing, particularly of oil/gas, vehicles, domestic appliances and high-end electronics. Despite taking up 22% of the economy and maintaining a steady contribution to the US economy from the 1950s onwards, the labour force engaged in manufacture has dropped by two thirds in 60 years, from 33% of employees in 1947 to around 10% in 2009.
This decline, the result of improved technology, higher efficiency and the importation of cheaper manufactured goods from the Far East, has left some areas, notably in the north east and New England, with high unemployment and social deprivation.
A switch to modern and more high-tech research and manufacturing has only partly helped the situation, especially in cities like Detroit, nicknamed Motor City, and Motown in the 1950s and 1960s due to the prevalence of the motor industry. While the city still hosts the worldwide headquarters for General Motors, it also reported unemployment of 20% in May 2011.
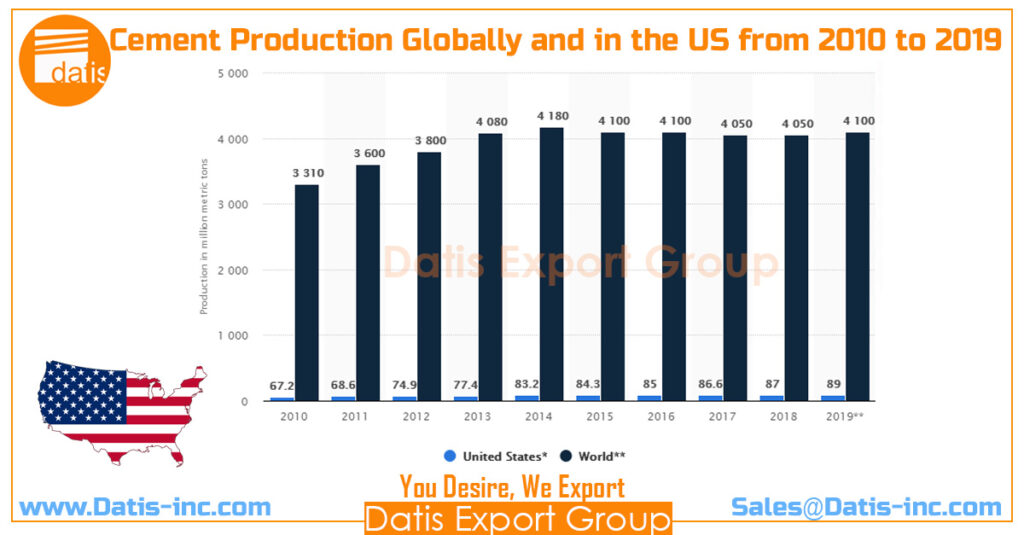
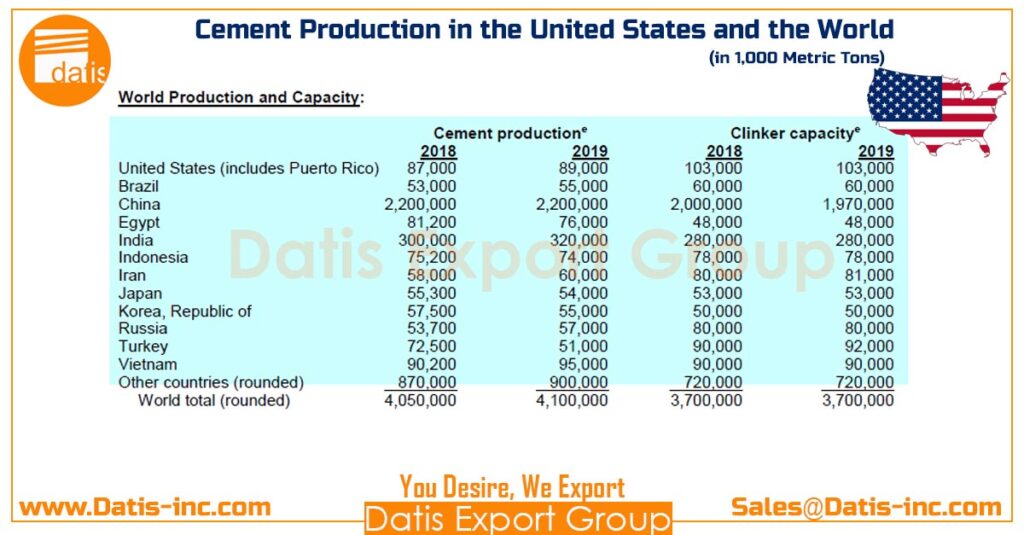
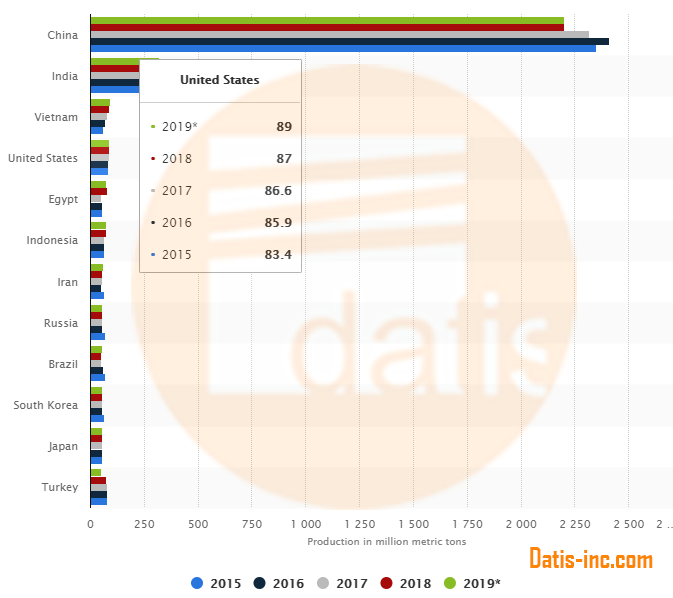
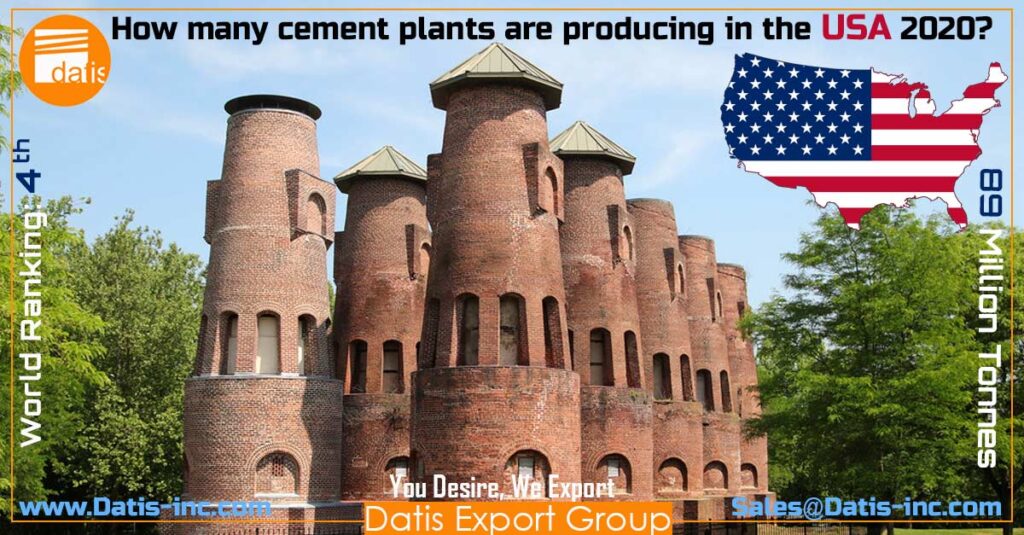
The US cement industry is one of the largest in the world, with an estimated installed capacity over 100Mt/yr. The 2012 edition of the Global Cement Directory puts the country third in terms of active and mothballed capacity (>113Mt/yr), behind China (>1400Mt/yr) and India (>230Mt/yr).
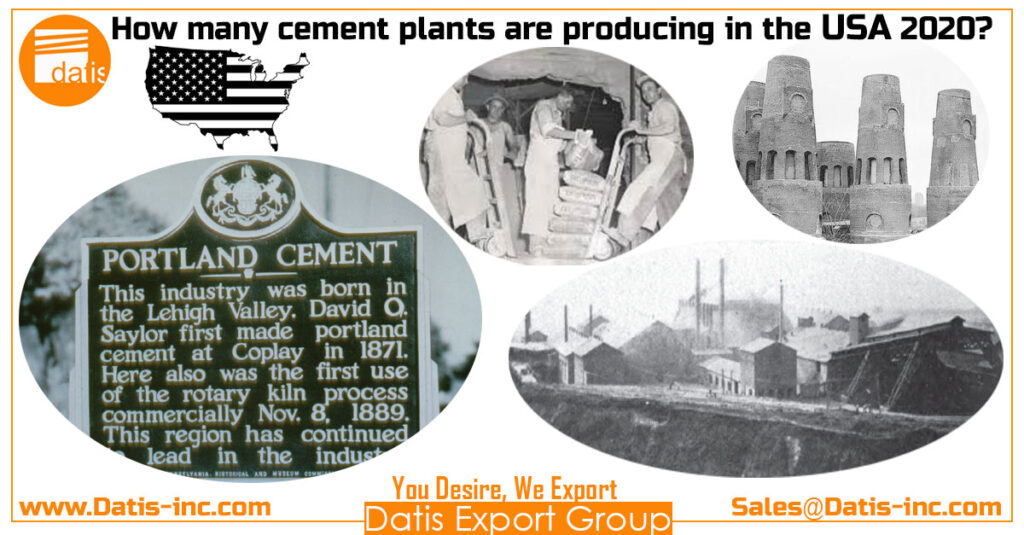
Its rise to this position started in the second quarter of the 19th Century, with the introduction of intermittent and continuous shaft kilns in the areas surrounding New York city. In 1825 the Erie Canal, between Buffalo to Lake Erie, an ambitious 584km-long construction project, was completed. Its construction was in large part thanks to recently discovered ‘meagre lime’ in the area.
An increasing number of limestone discoveries in the east and the ease of transport along the Mississippi River system in the Midwest led to the rapid establishment of a cement industry. Much of the industry is still concentrated in this area, with 25% of US cement being involved in some way with the system.
GDP (2011 est.) | US$ 1,504 bn |
GDP/capita (Est.) | US$ 47,955 |
Population (2012 Est.) | 313.8 m |
Area | 9,826,675 km2 |
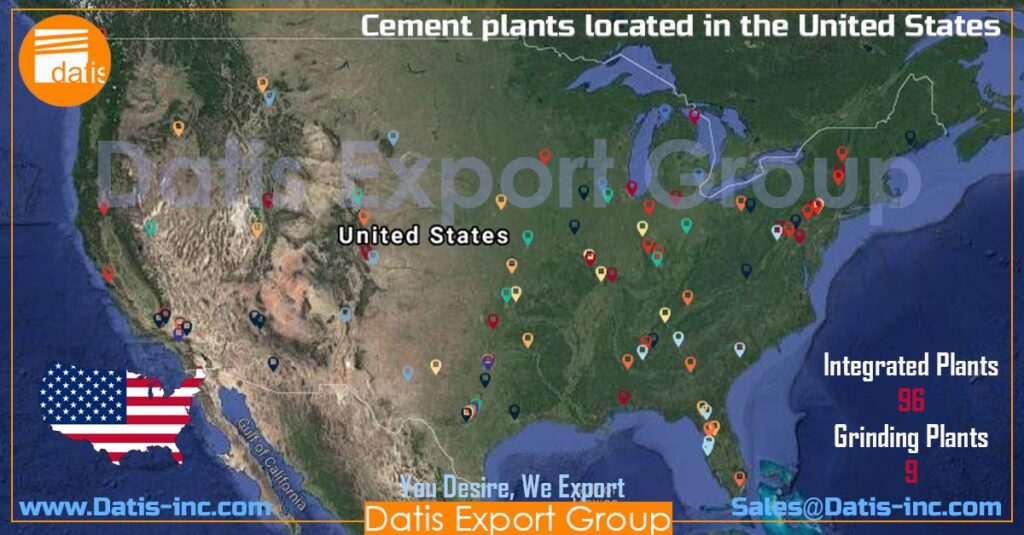
Integrated cement plants | 97 |
Integrated capacity | 114.7 Mt/yr |
Mothballed capacity | 6.8 Mt/yr |
- Above Table: Summary data for the United States of America and its cement industry.
The US Cement -Rotary revolution in the United States
It was in the early 1900s, however, that cement production really took off in the US, with the introduction of the rotary kiln. As early as 1900 there are accounts of the Lehigh Valley having 29 rotary kilns, which, though small by modern standards, each produced at more than twice the rate of previous methods. Incremental improvements led to higher and higher outputs, with the industry experimenting with preheaters and precalciners from the 1950s onwards and increasingly sophisticated automated production since then.
The industry has been overseen for the majority of its existence by a nationwide association, first known as the Association of American Portland Cement Manufacturers (AAPCM). The AAPCM was formed in 1902 to safeguard the interests of the industry. It was renamed the Portland Cement Association (PCA).
The US Cement – 2005 to 2011
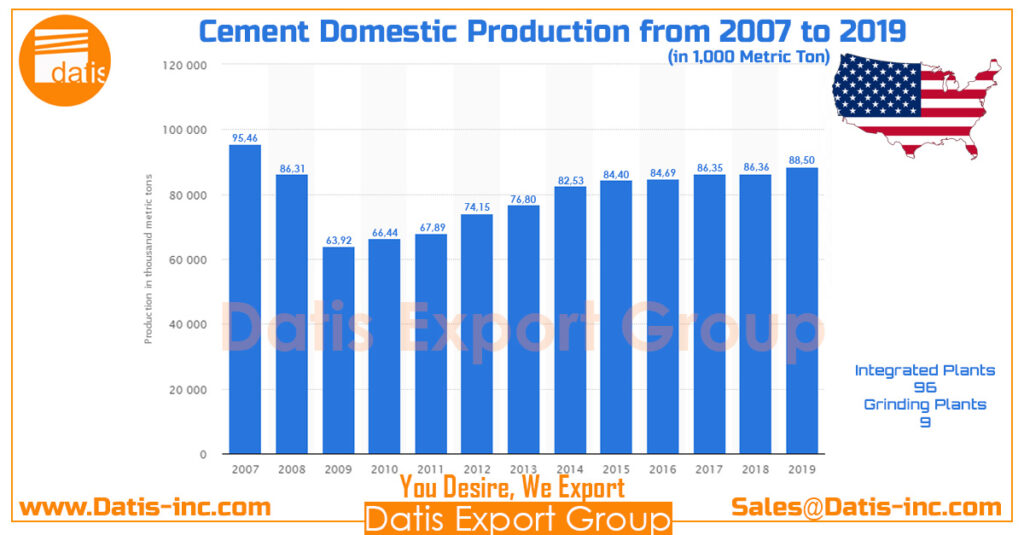
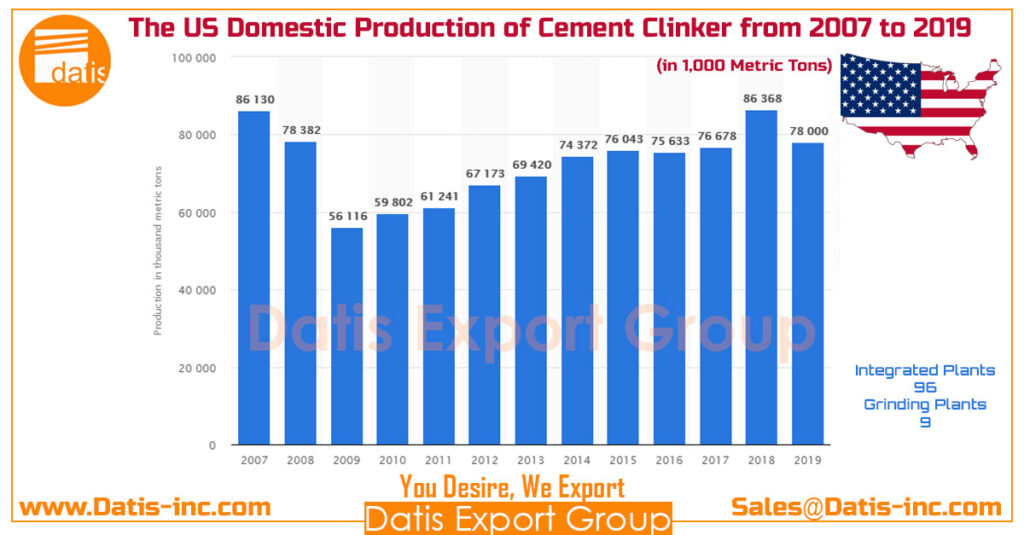
Despite its high modern capacity, the cement industry in the US is currently operating well below its headline figures. The PCA reports that in 2005, before the onset of the current fiscal problems, the US consumed approximately 122Mt of cement.
In 2006 this value held steady at 122Mt, in 2007 it dropped to 110Mt and in 2008 it fell to 93Mt. Even worse consumption was seen in 2009 and 2010, when the country consumed just 67-68Mt, nearly half of the level just five years previously. This represented a capacity-utilisation rate of just 67%.
The extent of the damage inflicted by the current economic downturn on the US cement industry can be seen by looking at cement consumption statistics from 2005, the peak of US cement demand, and 2010. Please refer to the tables below.
Over these five years 48 out of the 50 US States observed a decrease in cement consumption. Most badly affected were Arizona, (-69%), Florida (-68%), Nevada (-68%), Georgia (-61%) and California (-60%).
In terms of raw figures, Florida appears to be the worst affected state. Its drop in consumption coincided with a capacity increase from 5.1Mt/yr in 2005 up to 9Mt/yr in 2010!
In addition to the states in the ‘over 60%’ bracket, a further 23 states; Alabama, Colorado, Connecticut, the District of Columbia, Hawaii, Idaho, Illinois, Kentucky, Maine, Massachusetts, Michigan, Minnesota, Mississippi, New Hampshire, New Jersey, North Carolina, Ohio, Oregon, Washington, Rhode Island, South Carolina, Tennessee and Virginia, saw drops of 40% or more.
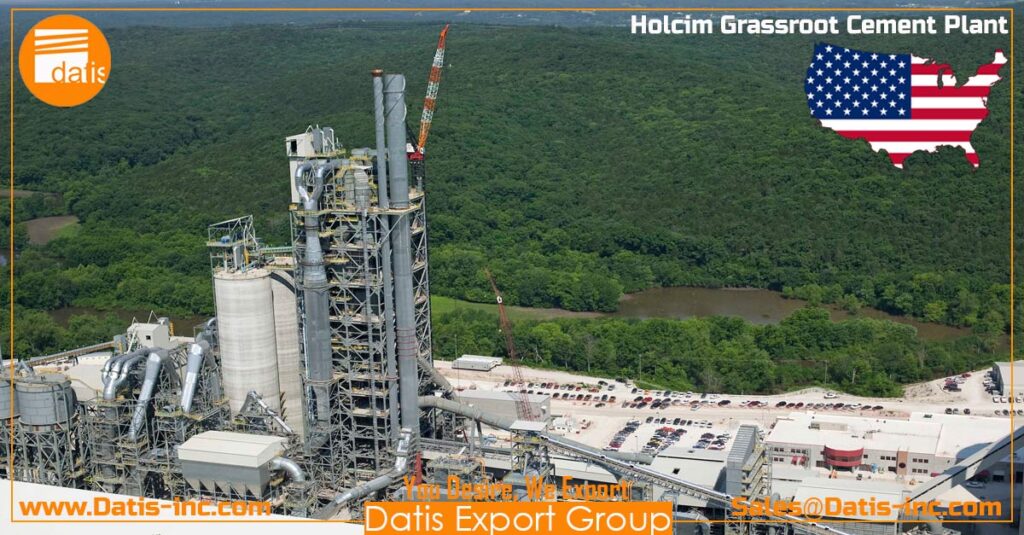
Notable among these is Missouri, which, like Florida, saw its installed capacity increase massively in the middle of 2009 with the arrival of Holcim’s 4Mt/yr Ste. Genevieve plant on the Mississippi River.
Many other states saw decreases well into double-digits over the same period, with only two states seeing a net increase in cement consumption over the same time period. These were Louisiana, where consumption increased by over a quarter, and North Dakota, where consumption was up by 17%, albeit at a low level.
Neither of these states has its own integrated cement plant and their combined consumption in 2010 was 3.15Mt, just 4.5% of the total consumption in the US in 2010. The only state to come out of the analysis relatively unscathed is South Dakota, one of the least populated states in the country, with an apparent drop in consumption of 6% between 2005 and 2010.
In 2011 cement consumption was again low at just 66Mt, still far down on the record production levels seen in 2005. Of the 50 US states, the top seven producers (in desending order by volume: Texas, California, Missouri, Florida, Pennsylvania, Michigan and Alabama) accounted for 53% of total US cement production for the year.